A set of three documents: An R refresher and a Shiny introduction, together with exercises.
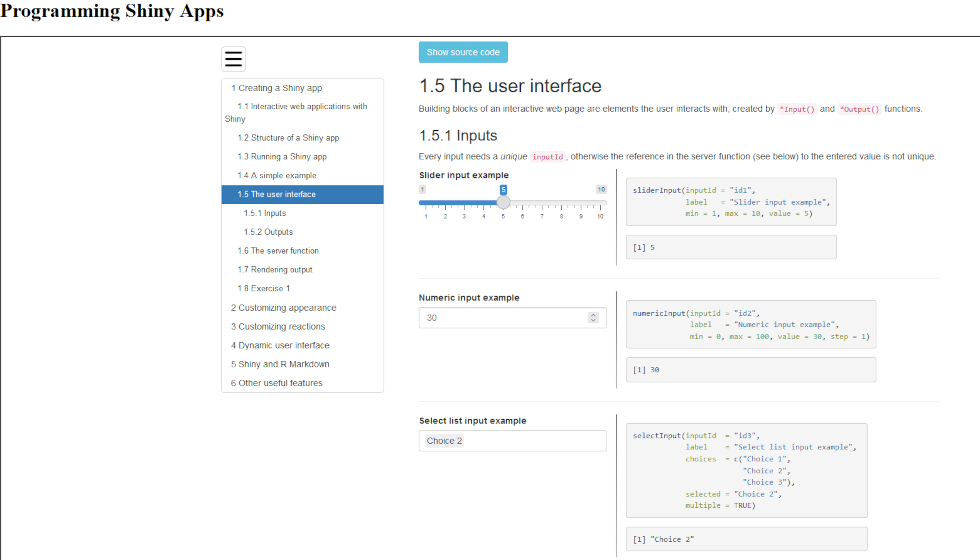
A set of three documents: An R refresher and a Shiny introduction, together with exercises.
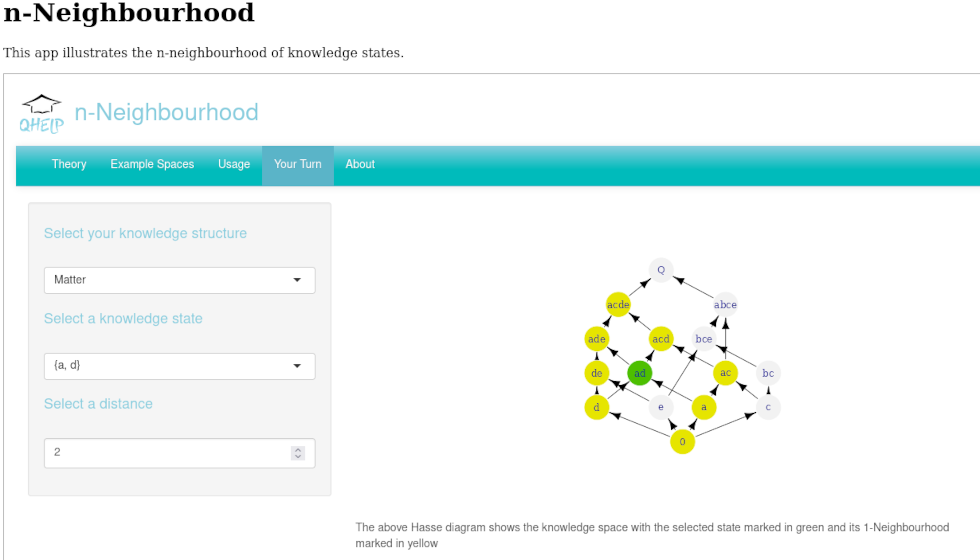
Illustrating neighbourhoods in knowledge structures.
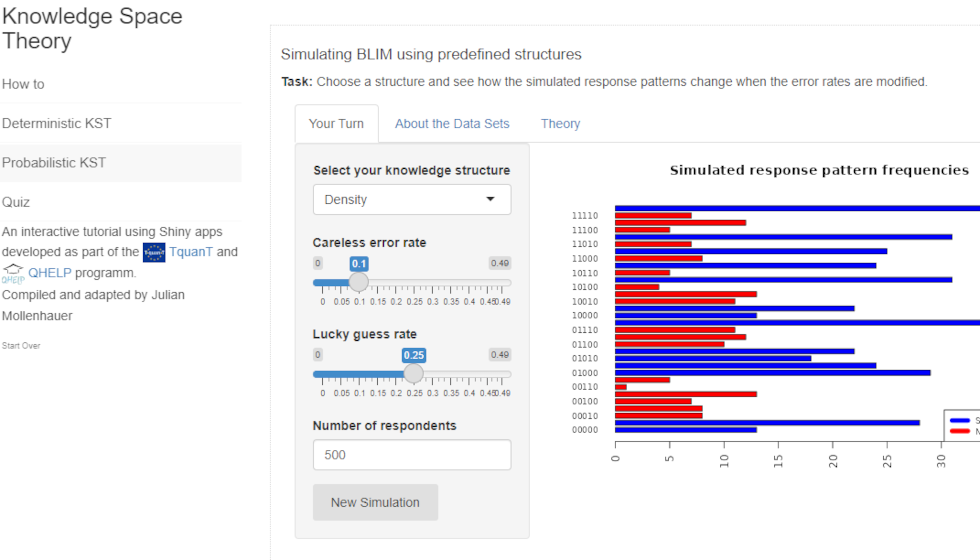
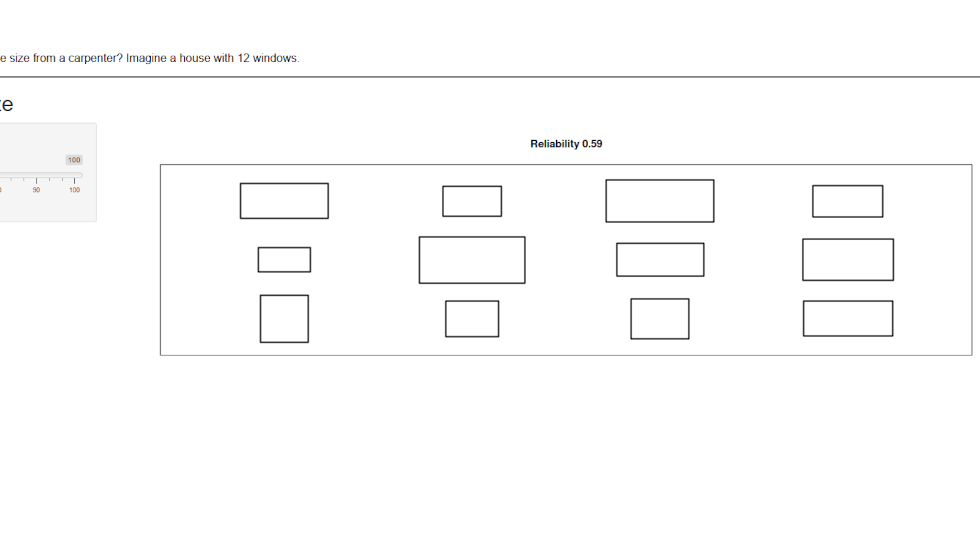
How would your house look like if the carpenter building the windows is not fully reliable?
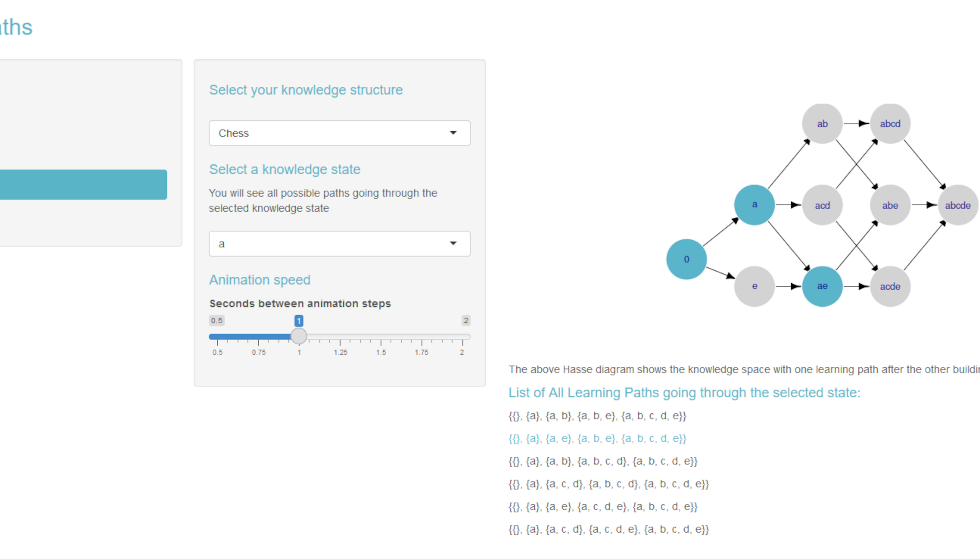
This app illustrates the concept of learning paths in a knowledge structure. It is an extension of an app from the TquanT project.
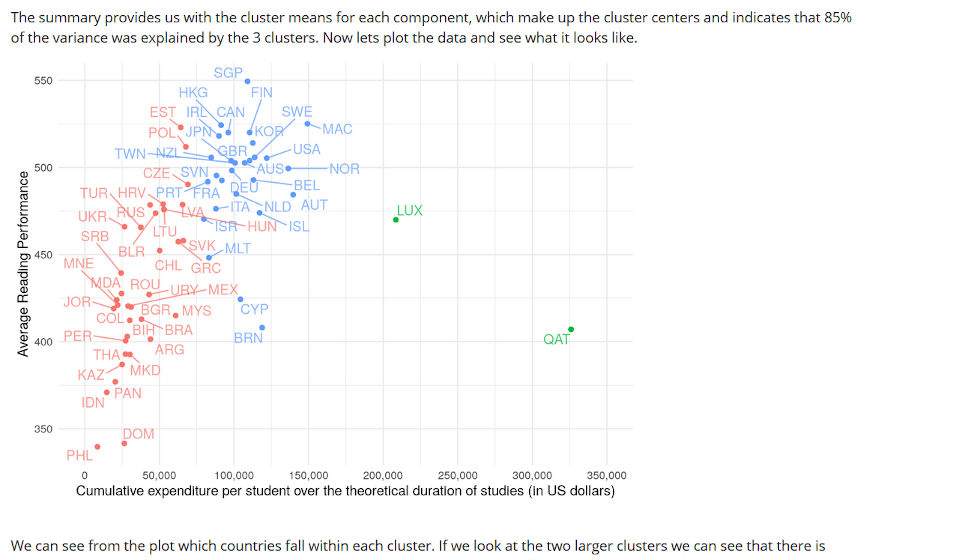
A series of interactive tutorials introducing principle component analysis, clustering, linear modelling and cross-validation for large datasets.
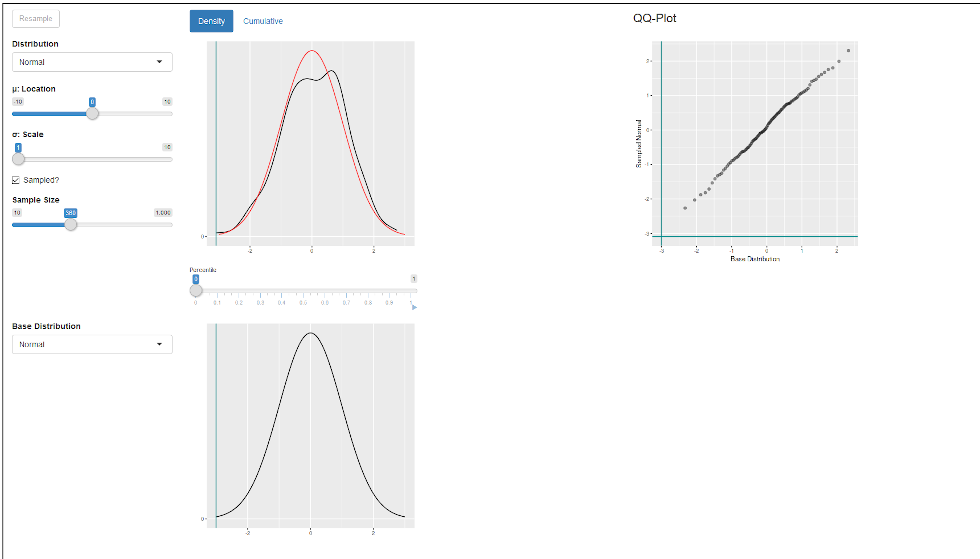
This Shiny app is meant to let you play around with a few different distributions (Normal, Skew Normal, Cauchy, Skew Cauchy), and check what the effect of different variables (scale, location and shape) on their qq-plot is.
The qq-plots are all a comparison with a default normal distribution (mean=0, sd=1). There is a large slider you can use to track specific percentiles on all graphs. This Shiny app was made for teaching purposes.
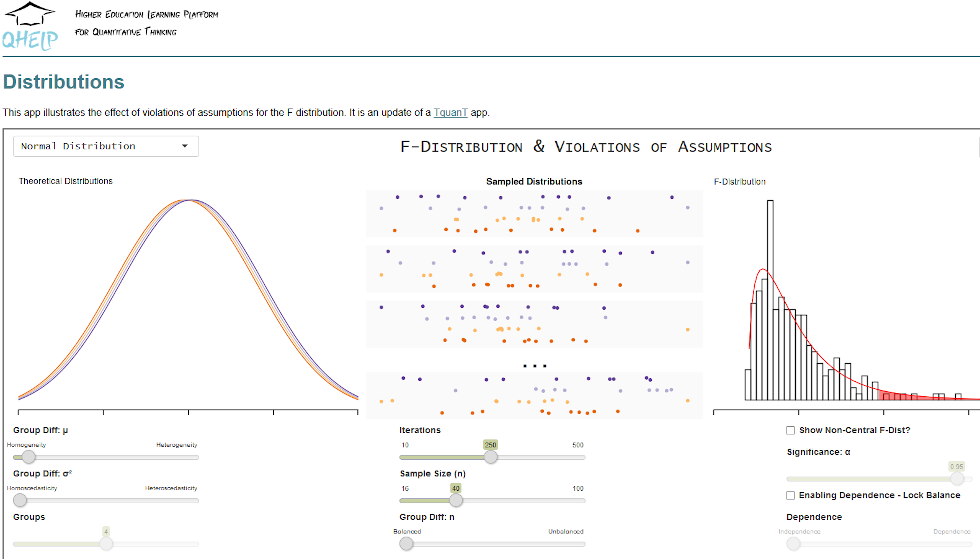
This app illustrates the effect of violations of assumptions for the F distribution. It is an update of a TquanT app.
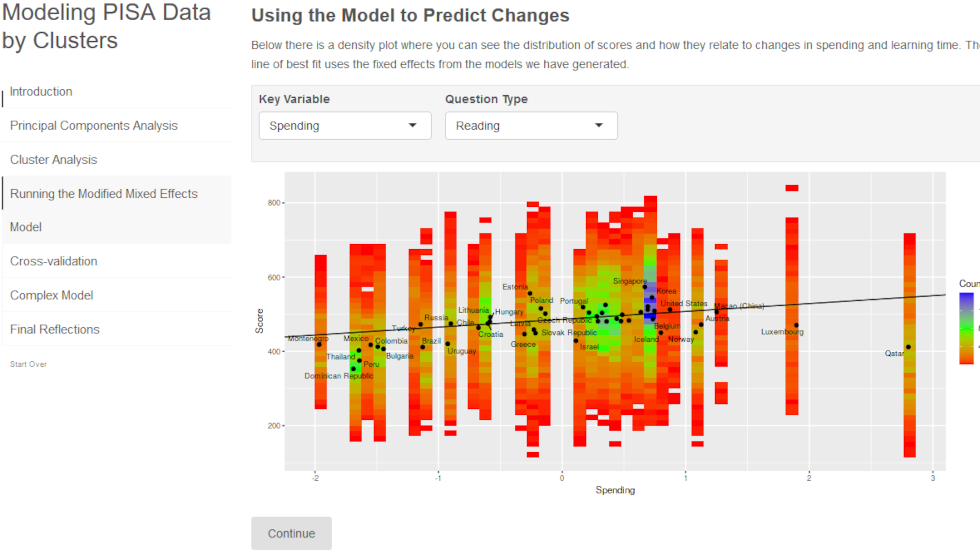
An illustration of statistical learning and visualisation techniques using real-world data (PISA).
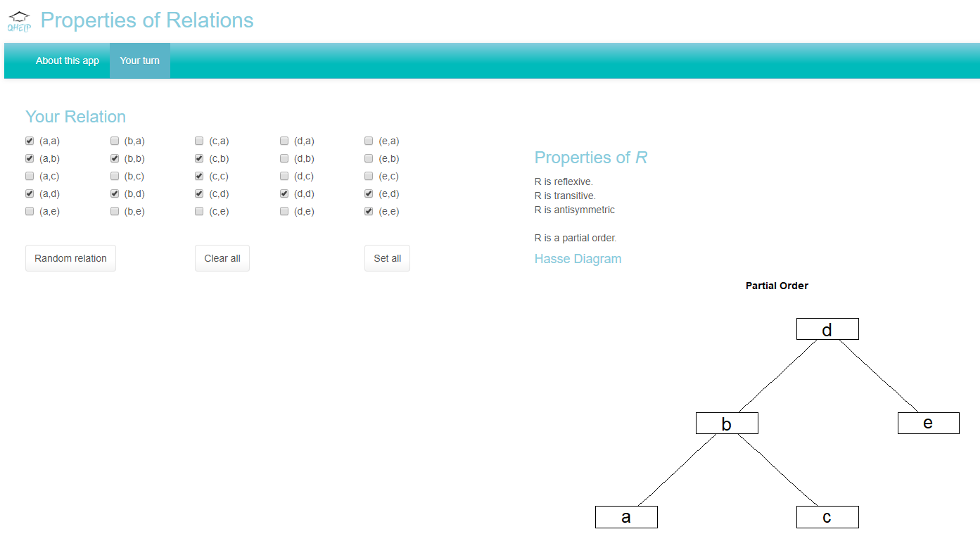
This app allows you to define an arbitrary binary relation on a set of five items and shows you whether certain properties are fulfilled.